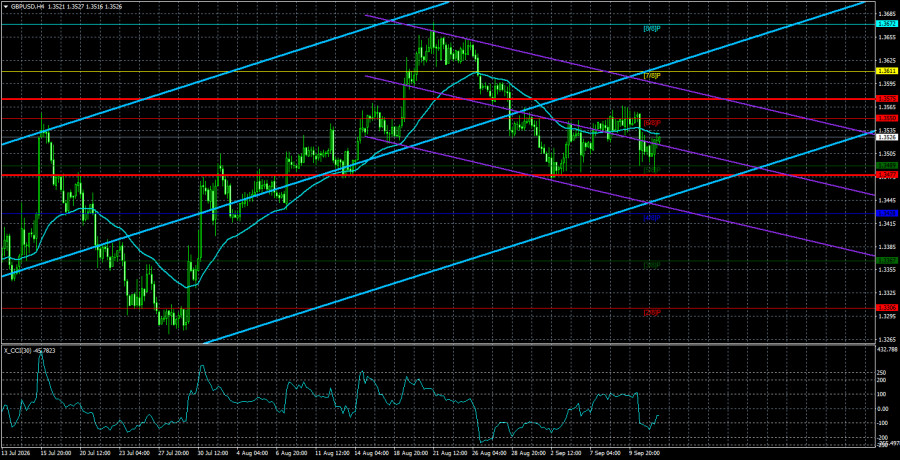
The GBP/USD currency pair on Friday again traded as if doing someone a favor. Over the day, the price moved 52 pips, which is very little given the inflation report publication that the market awaited even more eagerly than the European Central Bank meeting. Immediately, looking at the charts, you would not even understand that an important report was released on Friday. There were no significant price changes, spikes, or crashes. Recall also that the reaction to last Friday's Nonfarm Payrolls was weak, and the reaction to the annual NFP the Friday before that was also weak. The last time the market really moved was August 19, when the US Treasury announced a decision to increase open-market purchases of bonds to lower yields. As with any decision by the current US administration, it produced a dizzying result. Since then the 10-year yield has risen another 5% and the 30-year yield by 1%. Thus, even if the US Treasury buys back its own bonds by tens or hundreds of billions of dollars each month, plunging the country deeper into debt, investors will not buy Treasuries more willingly or at lower rates.
Returning to "last week's report." US inflation for August was unchanged at 3.4%. Core inflation fell to 2.4%, and the market may be underestimating something in core inflation. The current level of headline inflation calls for monetary tightening if the Federal Reserve wants to slow it, not only rhetorically. Moreover, the August producer-price index suggests inflation will most likely accelerate in September. Current oil, fuel, and gas prices also point to rising inflation. Thus, current consumer-price levels are high and will likely rise further in September. Does that mean the Fed has no option but to raise the key rate?
In our view, no. First, inflation did not increase in August, and what happens in September will happen in September. Why should Kevin Warsh and company rush if earlier they saw no reason to tighten and some FOMC members spoke of a continued disinflation process? If inflation is not rising, it means it is easing. Why raise rates then? The Fed could have tightened in the summer but did not. Why must it act in September?
Second, the Fed can shift market attention from headline to core inflation and make core the primary metric. Core inflation stands at only 2.4% and is not rising either. That makes monetary tightening even less justified. Remember that a rate hike is a blow to the economy, its growth rates, and the labor market. And the US labor market has been barely breathing for at least a year and a half.
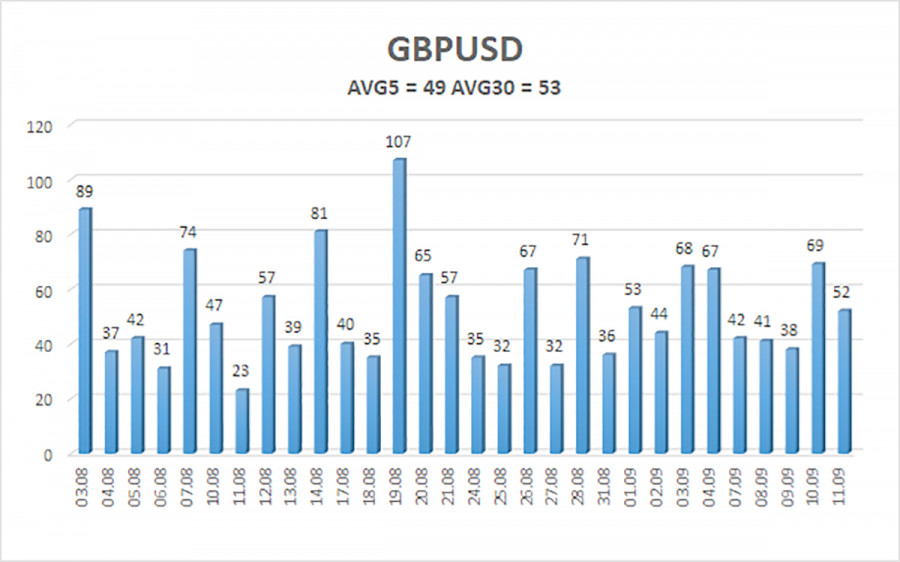
The average volatility of the GBP/USD pair over the last 5 trading days is 49 pips. For the pound/dollar, this value is "low." On Monday, September 14, we therefore expect movement inside a range bounded by 1.3477 and 1.3575. The higher linear regression channel has turned up, indicating an uptrend. The CCI entered the oversold area, warning of a possible end to the correction.
S1 – 1.3489
S2 – 1.3428
S3 – 1.3367
R1 – 1.3550
R2 – 1.3611
R3 – 1.3672
The GBP/USD pair maintains an upward trend. Donald Trump's policy will continue to weigh on the US economy, so we do not expect long-term strength from the US dollar. 2026 has been positive for the dollar so far because of geopolitics, but every tale comes to an end. On the weekly timeframe, a flat remains between 1.3150 and 1.3780 within a four-year uptrend, supporting expectations for continued pound appreciation in the medium term. Consider long positions with targets of 1.3575 and 1.3611 while price is above the moving average. Price below the moving average would justify a downward trade, with targets of 1.3489 and 1.3477.
Regression channels help determine the current trend. If both are directed in the same direction, it means the trend is currently strong;
The moving average line (settings 20,0, smoothed) defines the short-term trend and the direction in which trading should be conducted at present;
Murray levels are target levels for moves and corrections;
Volatility levels (red lines) are the probable price channel within which the pair will spend the next 24 hours based on current volatility indicators;
The CCI indicator – its entry into the oversold area (below -250) or the overbought area (above +250) indicates that a trend reversal in the opposite direction is approaching.

SZYBKIE LINKI
ForexMart is authorized and regulated in various jurisdictions.
(Reg No.23071, IBC 2015) with a registered office at First Floor, SVG Teachers Co-operative Credit Union Limited Uptown Building, Corner of James and Middle Street, Kingstown, Saint Vincent and the Grenadines
Restricted Regions: the United States of America, North Korea, Sudan, Syria and some other regions.


 Skontaktuj się z ForexMart