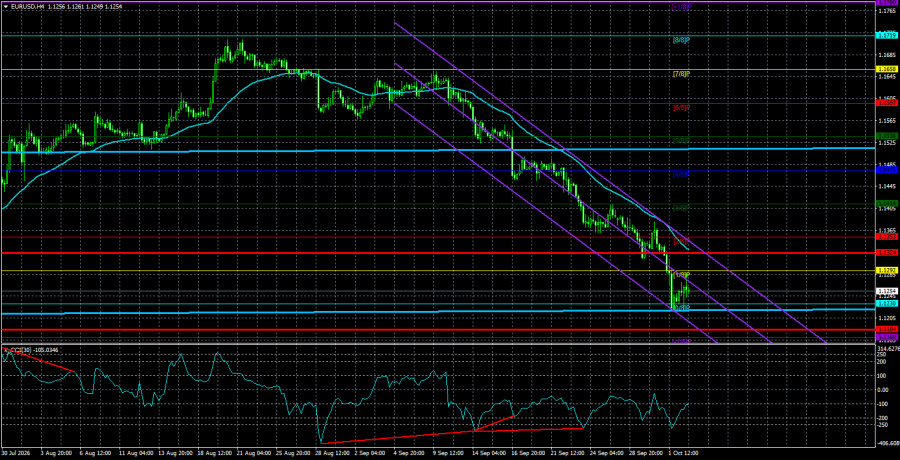
The EUR/USD currency pair rose about 10 pips on Friday, no more. And this happened on a day when the US released important and absolutely poor Nonfarm Payrolls and unemployment reports. Does anyone need more proof that the current rise of the dollar has no fundamental, macroeconomic, or geopolitical basis? Recall that the Middle East conflict remains in a "frozen" state, and nothing significant has changed recently. Therefore, the dollar cannot be rising on heightened geopolitical tension. Market expectations for Federal Reserve tightening weakened after September (and we will discuss this further). Thus, the monetary factor cannot be the basis for the US currency's rise either. Last week's macro indicators were disastrous for the dollar (the labor market weakened, unemployment rose, and PCE inflation did not accelerate). Therefore, the macro factor could not be the reason for the dollar's strength.
The apotheosis of absurdity was Friday, when reports key for Fed policy showed values "below the floor." If EUR/USD had at least corrected up that day and then resumed its decline, that would have been somewhat logical. One could have assumed the market still expects Fed tightening while not ignoring obvious facts and macro reports. But instead, we saw the dollar decline by only about 10 pips, which only reinforces the illogicality of the US currency's rise—something we have been saying for two weeks.
In practice, the market and its participants made a clever move on Friday. Instead of concluding the Fed has softened its stance on the key rate, they shifted their "hawkish" expectations from October to December. Now ask this question: if the labor market shows weak readings not just once but consistently, what does that indicate? In our view, it signals a negative trend that has persisted for at least a couple of years. Thus, if the labor market continues to weaken, should we expect aggressive Fed tightening? We are no longer even talking about the fact that the market priced in two rate hikes long ago. In short, the market has already priced in dollar support that does not yet exist and may never materialize.
Recall that on the FX market, moves often occur that are extremely difficult to explain even after the fact. Some experts still try, looking for a spoonful of honey in a barrel of tar or vice versa. In practice, it looks like this: a poor Nonfarm Payrolls report is released, which should inevitably trigger a dollar sell-off, but the conclusion drawn is roughly: policy will still be tightened, and the report is not that bad. It is even worse: 90k jobs were forecast, but only 30k were created. At the same time, the "very high" August figure was revised down.
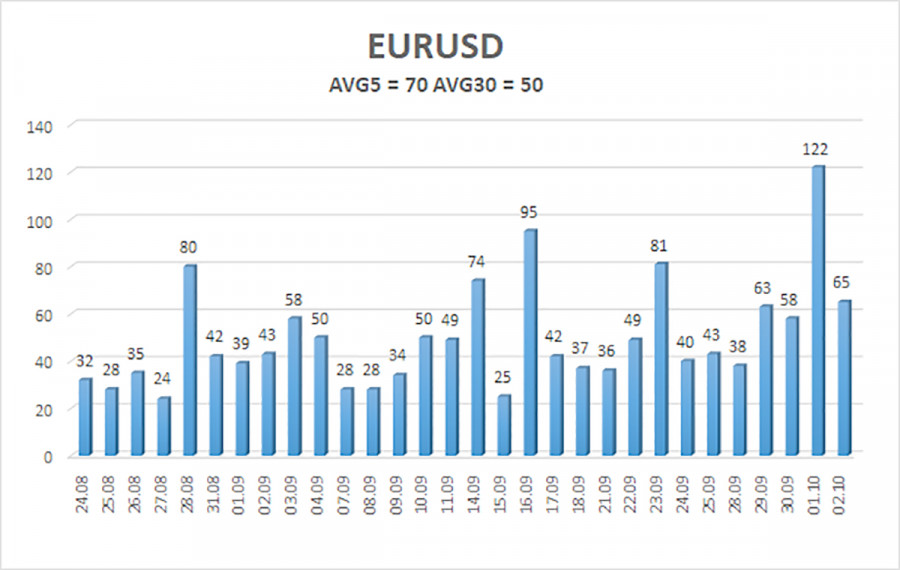
The average volatility of the EUR/USD currency pair over the last 5 trading days as of October 5 is 70 pips and is characterized as "average." We expect the pair to move between 1.1184 and 1.1324 on Monday. The higher linear regression channel is directed upward, indicating an uptrend. The CCI indicator entered the oversold area three times and formed three "bullish" divergences, which warn of the end of the illogical downtrend. However, the market is not reacting to anything right now.
S1 – 1.1230
S2 – 1.1169
S3 – 1.1108
R1 – 1.1292
R2 – 1.1353
R3 – 1.1414
The EUR/USD pair continues to move downward, but we still view the pair's decline as a correction before a new uptrend. The global fundamental backdrop for the dollar remains negative, but in 2026, geopolitical events first, and then the Fed's "hawkish" stance, provided strong support to the US currency. When the price is below the moving average, consider short positions with targets of 1.1184 and 1.1108. Above the moving average line, long positions are relevant, with targets of 1.1414 and 1.1475.
ForexMart is authorized and regulated in various jurisdictions.
(Reg No.23071, IBC 2015) with a registered office at First Floor, SVG Teachers Co-operative Credit Union Limited Uptown Building, Corner of James and Middle Street, Kingstown, Saint Vincent and the Grenadines
Restricted Regions: the United States of America, North Korea, Sudan, Syria and some other regions.





 联系我们
联系我们