Jihoafrická vláda v pátek uvedla, že cla, která tento týden oznámil prezident Donald Trump, fakticky ruší výhody, které africkým zemím poskytuje americká obchodní iniciativa African Growth and Opportunity Act (AGOA).
Platnost AGOA, která africkým zemím splňujícím podmínky poskytuje bezcelní přístup na americký trh, vyprší v září. A Trumpova dalekosáhlá cla naznačují, že obnovení obchodní dohody přijaté v roce 2000 je nyní nepravděpodobné.
Ministři zahraničních věcí a obchodu Jihoafrické republiky na tiskové konferenci uvedli, že vláda může usilovat o zajištění dalších výjimek a kvót s USA a také o diverzifikaci svých vývozních trhů.
„Rozsáhlá celní opatření se dotknou několika odvětví naší ekonomiky, včetně automobilového průmyslu, zemědělství, zpracovaných potravin a nápojů, chemického průmyslu, kovů a dalších segmentů výroby, což bude mít dopad na zaměstnanost a růst,“ uvedli oba ministři ve společném prohlášení.
„Vláda bude strategicky investovat do průmyslových odvětví, na něž mají cla dopad, a podpoří hospodářský růst prostřednictvím modernizace a cíleného rozvoje infrastruktury.“
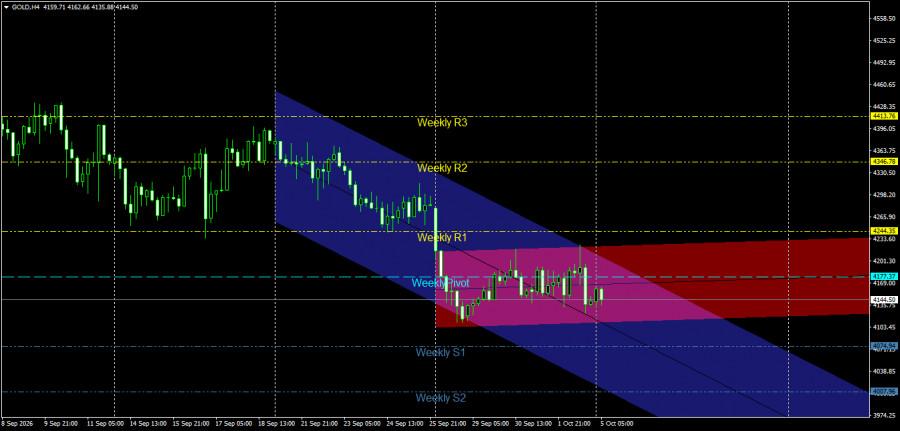
The 4-hour (H4) chart for Gold (GOLD) shows price action under selling pressure; the price is currently trading at the 4144.50 level—near the midline of its price channel—attempting to determine its next direction amidst noticeable fluctuation around the weekly pivot line.
Technical Analysis and Price Action
Price Channel Structure: The price is moving within a primary bearish channel (blue), reflecting the overall negative trend that began following the decline from the third weekly resistance level (Weekly R3) at 4413.76 and subsequently the second resistance level (Weekly R2) at 4346.78. Concurrently, a secondary bearish path (pink/red) is forming, exerting pressure on intraday movement and limiting attempts at an upward recovery.
Interaction with Pivot Levels: The price experienced a sharp break below the first weekly resistance level (Weekly R1) at 4244.35, reaching the weekly pivot point (Weekly Pivot) at 4177.37. It is currently fluctuating below this pivotal zone, demonstrating the buyers' inability to assert control and decisively break above the pivot; this keeps the advantage with the sellers in the near term.
Key Support and Resistance Levels
Key Resistance Levels:
Resistance 1: 4177.37 (Weekly Pivot Point).
Resistance 2: 4244.35 (Weekly R1). Key Resistance: Level 4346.78 (Weekly R2).
Key Support Levels:
Support 1: Levels 4103.45 – 4135.75 (near-term intraday lows).
Support 2: Level 4074.94 (Weekly S1).
Key Support: Level 4007.96 (Weekly S2 and the channel's lower boundary).
Price Action Outlook and Trading Recommendations
Bearish Scenario (Primary):
Bearish momentum is the most likely outcome as long as the price trades below the Weekly Pivot (4177.37) and within the bearish pink/blue zone.
Recommendation: Sell upon a retest of the 4177.37 level if resistance holds, or upon a break below the 4135.75 zone.
Technical Targets: Target the 4103.45 zone first, followed by Weekly S1 at 4074.94; targets extend toward 4007.96 if selling pressure intensifies.
Stop Loss: A 4-hour candle close above 4201.30.
Bullish Corrective Scenario (Alternative):
Triggered if the price successfully breaks above the Weekly Pivot (4177.37) and stabilizes there with a strong 4-hour candle.
Confirmation Condition: Breaking 4177.37 and holding above it. Technical Targets: Initiating a positive corrective wave targeting the first weekly resistance level at 4244.35.
Risk Management
Trading gold requires strict adherence to risk management rules and the precise setting of stop-loss orders to withstand sharp price volatility, while keeping risk within 1% to 2% of total capital per trade.
The H1 chart for gold reveals price action under mounting bearish pressure; the price is currently trading around the 4144.25 level, attempting a brief intraday recovery after breaking below key pivot levels and breaching the lower boundary of a technical consolidation range.
Technical Analysis and Price Action
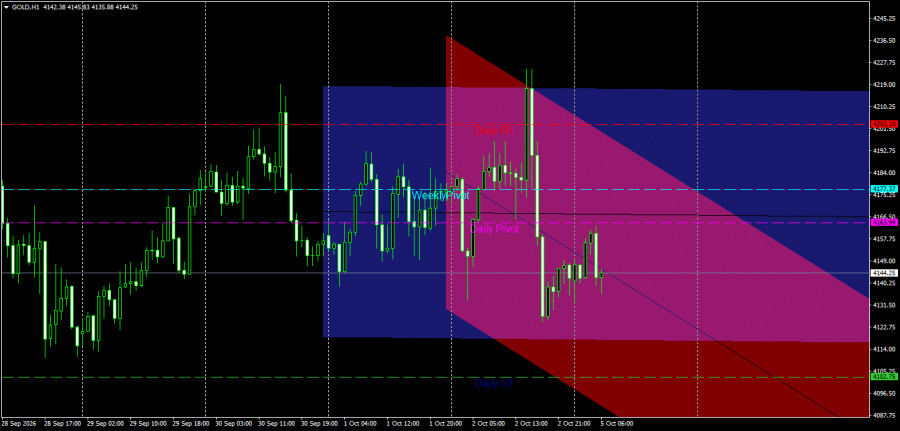
Price Channel Structure: The price is trading within an accelerating bearish channel (pink/red), which is exerting downward pressure on intraday movement following a sharp pullback from the peak near the first daily resistance level (Daily R1) at 4201.50–4203.10. Additionally, a prior sideways movement (blue) was broken to the downside, reinforcing the price's bearish intraday trajectory.
Interaction with Pivot Levels: Gold faced intense selling pressure, leading to successive breaks below the Weekly Pivot (4177.37) and the Daily Pivot (4163.94–4166.50). The price currently sits below all these pivotal levels, implying that any potential rise would likely be merely a corrective move to retest resistance.
Key Support and Resistance Levels
Key Resistance Levels:
Resistance 1: 4163.94–4166.50 (Daily Pivot).
Resistance 2: 4177.37 (Weekly Pivot). Pivot Resistance: 4201.50 – 4203.10 (Daily R1).
Key Support Levels:
First Support: 4131.50 (recent intraday low).
Second Support: 4102.75 – 4105.25 (Daily S1).
Key Support: 4087.75 – 4096.50 (lower boundary of the descending channel).
Price Action Outlook and Trading Recommendations
Bearish Scenario (Primary):
A bearish trend is the most likely outcome in the near term as long as the price trades below the daily pivot (4163.94) and within the descending channel.
Recommendation: Sell upon a retest of the 4163.94 – 4177.37 resistance zone (provided resistance holds) or upon a break below the intraday low of 4131.50.
Technical Targets: Target Daily S1 at 4102.75 as the primary objective, with a potential extension to 4087.75 if selling pressure intensifies.
Stop Loss: A one-hour candle close above 4184.00.
Bullish Corrective Scenario (Alternative):
Triggered if the price breaks above the daily pivot (4163.94) and establishes itself there with a strong one-hour candle.
Confirmation Condition: Breaking above 4163.94, followed by the weekly pivot at 4177.37, and holding above both levels. Technical Targets: Initiating a positive corrective wave targeting 4,192.75, extending to the first daily resistance level at 4,201.50.
Risk Management
Trading gold on short timeframes (H1) requires a high degree of caution and strict adherence to stop-loss orders to avoid price slippage, while limiting risk to no more than 1%–2% of capital per trade.

روابط سريعة
ForexMart is authorized and regulated in various jurisdictions.
(Reg No.23071, IBC 2015) with a registered office at First Floor, SVG Teachers Co-operative Credit Union Limited Uptown Building, Corner of James and Middle Street, Kingstown, Saint Vincent and the Grenadines
Restricted Regions: the United States of America, North Korea, Sudan, Syria and some other regions.





 وماهو رأيك